

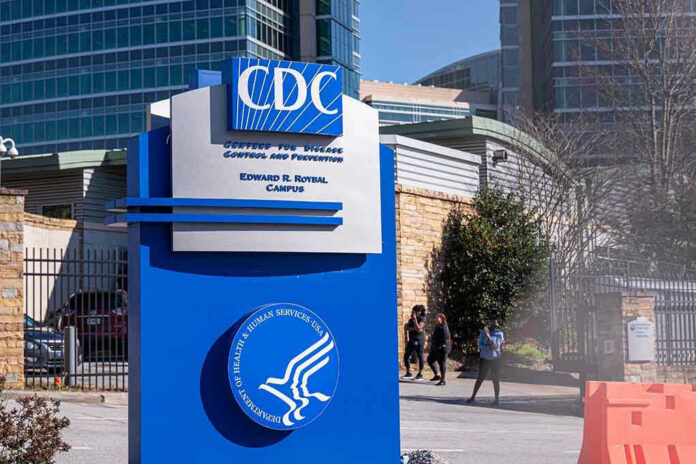
The United States death rate reached its lowest point in recorded history in 2025 — and that fact, backed by data covering 99.9% of the year’s death certificates, is not a rounding error or a statistical artifact. It is a genuine, measurable turning point in American public health, one that deserves to be understood on its own terms rather than filtered through the political noise that has surrounded it.
At a Glance
- The age-adjusted death rate fell 4.6% in 2025 to 689.2 deaths per 100,000 people — the lowest ever recorded in over a century of national tracking.
- The rate is now 22% below its 2021 pandemic peak and 4% below pre-pandemic 2019 levels, suggesting the improvement extends beyond simple COVID-19 normalization.
- Drug overdose deaths dropped sharply, with approximately 70,000 fatalities in 2025 — a significant decline from prior years when the toll exceeded 100,000 annually.
- Death rates fell across every age group and both sexes, though meaningful disparities persist: Black Americans face the highest age-adjusted rate at 869 per 100,000, and some Indigenous populations saw rates rise.
- Influenza and pneumonia deaths climbed 17%, a countertrend that underscores how the record low is driven by specific causes rather than uniform health gains across the board.
What the Numbers Actually Show
The CDC’s National Center for Health Statistics released its Vital Statistics Rapid Release report in July 2026, drawing on the National Vital Statistics System — the most comprehensive mortality tracking infrastructure the United States operates. The provisional dataset reflected 99.9% of 2025 death records processed as of May 10, 2026, a completeness level that effectively eliminates meaningful uncertainty about the headline figure. The age-adjusted rate of 689.2 per 100,000 compares against 722.1 in 2024 and 750.5 in 2023, continuing a trajectory of decline that began as the acute phase of the COVID-19 pandemic receded.
Age adjustment is the critical methodological tool here. Because the raw count of deaths — approximately 3.09 million in 2025, actually higher than 2024’s 3.07 million — rises naturally as the population ages and grows, the crude number tells you relatively little about whether Americans are dying at higher or lower rates. Age adjustment standardizes against a reference population, allowing genuine year-over-year comparison. By that measure, 2025 was historically good — the best on record since systematic national tracking began in the early twentieth century.
The Overdose Reversal: The Single Largest Driver
The most consequential factor behind the 2025 record is the collapse in drug overdose deaths. For several consecutive years beginning around 2020, overdose fatalities exceeded 100,000 annually — a staggering toll that made unintentional injuries the third leading cause of death and dragged the overall mortality rate upward even as deaths from other causes declined. The preliminary CDC figure for 2025 stands at approximately 70,000 overdose deaths, representing a reduction on the order of 30% from the peak years. That single shift, compressing the third-largest category of American mortality, carries enormous statistical weight in the age-adjusted calculation.
The mechanisms behind the overdose decline are multiple and still being disentangled. Expanded access to naloxone — the opioid-reversal medication — played a documented role, as did the maturation of harm-reduction infrastructure in many states. Law enforcement pressure on fentanyl supply chains, including interdiction at the southern border, contributed in ways that are difficult to isolate but epidemiologically plausible. Health experts cited by the CDC’s reporting emphasized the overdose decline as the primary driver of the overall rate improvement; attributing it exclusively to any single policy or administration oversimplifies a multi-causal phenomenon that unfolded across years and jurisdictions.
A Decline Across Age Groups — With Important Exceptions
The report’s finding that death rates fell for every age group is genuinely notable; broad-based declines of this kind are rarer than headline improvements in any single cohort. That said, the distribution was uneven. The smallest proportional drop — less than half the overall 4.6% decline — occurred among adults aged 45 to 54, a group that has historically borne disproportionate mortality from the opioid crisis and from cardiovascular disease. The largest improvements clustered at the extremes of age, where COVID-related mortality had been most concentrated.
Racial and ethnic disparities remain stark and, in some cases, worsened. Black Americans carry the highest age-adjusted death rate at 869 per 100,000 — 26% above the national average. American Indian and Alaska Native people saw their rate increase, from 786.1 to 803.8 per 100,000, as did Native Hawaiian and other Pacific Islander populations. These are not footnotes to the record-low story; they are its most important caveat. A national average that reaches a historic low while specific communities experience rising mortality is a public health success and a public health failure simultaneously, depending on where you sit.
The Countertrend: Influenza and Pneumonia’s Resurgence
The 2025 flu season was severe by recent standards, and the mortality data reflects it. Influenza and pneumonia deaths rose 17% year-over-year, climbing from 48,139 in 2024 to 56,511 in 2025, which pushed the combined category from eleventh to eighth place among leading causes of death. This is the kind of countertrend that matters for interpreting the record low correctly: the overall rate improvement was driven by large declines in overdose and COVID-related deaths, not by a uniform reduction in mortality risk across all disease categories. Heart disease and cancer — the first and second leading causes, with 694,708 and 622,832 deaths respectively — both increased in absolute terms from 2024, even as their age-adjusted rates declined.
This pattern is familiar to mortality epidemiologists. Record-low overall rates often coexist with deterioration in specific cause categories, because the dominant drivers of change — pandemic recessions, overdose crises, vaccination campaigns — operate on a different scale than the slow, chronic accumulation of cardiovascular and oncological deaths. The 2025 data fits that pattern precisely.
The U.S. death rate fell to a record low in 2025, according to provisional data from the Centers for Disease Control and Prevention (CDC) released Thursday. https://t.co/RFrUEVl1Ag
— WNCT (@wnct9) July 3, 2026
How Provisional Data Works — and Why It Holds Up Here
The report carries a provisional designation, which prompts reflexive skepticism in some quarters. It is worth understanding what that label actually means in the context of the National Vital Statistics System. Death certificate submission timelines vary by state; some jurisdictions are faster than others, and cause-of-death coding for complex cases can lag months behind the event. The NCHS releases provisional data on a rolling basis precisely to provide timely information while final coding is completed. By the time the May 2026 processing cutoff was reached, 99.9% of 2025 death records had been incorporated — a completeness level that renders the provisional caveat essentially academic for the headline rate. Final data, expected in late 2026 or early 2027, may adjust specific cause-of-death counts at the margins; it is extraordinarily unlikely to alter the age-adjusted rate enough to dislodge the record-low finding.
The trajectory itself provides additional confidence. The 2024 final data showed an age-adjusted rate of 722.1, down 3.8% from 750.5 in 2023. The 2025 provisional figure of 689.2 continues that consistent directional movement. No methodological artifact produces a smooth multi-year decline of this magnitude; the signal is real.
What a Record Low Actually Means for American Longevity
Life expectancy — the summary measure most people reach for when assessing population health — is projected to reach a record high for 2025, building on the 0.6-year gain recorded in 2024 that brought the figure to 79.0 years. That projection will be confirmed when final mortality data is complete, but the age-adjusted rate improvement makes it arithmetically near-certain. The United States spent much of the 2010s watching its life expectancy stagnate or decline — a phenomenon driven largely by the opioid crisis and, for a period, by rising middle-age mortality among white Americans without college degrees. The pandemic then compressed life expectancy sharply in 2020 and 2021. The recovery since 2022 has been faster than many demographers anticipated.
The 22% decline in the age-adjusted rate since the 2021 pandemic peak is the most dramatic four-year improvement in American mortality history outside of wartime. That it has now pushed below pre-pandemic 2019 levels — by 4% — means the country has not merely recovered lost ground but surpassed its prior trajectory. Whether that trajectory holds depends on whether the overdose decline proves durable, whether cardiovascular mortality can be bent downward through continued pharmaceutical and behavioral intervention, and whether the disparities affecting Black, Indigenous, and other communities of color are addressed with the same urgency applied to the opioid crisis. The record is real. The work is not finished.
Sources:
© whatnewsdaily.com 2026. All rights reserved.